


Valuation metrics can seem dry, but understanding them will transform your view of investing. I’ll keep the math straightforward, avoiding anything more complex than basic intuition - no advanced algebra needed.
The Deceptively Simple Truth About Stock Prices
The single most important driver of your long-term stock returns is the price you pay today.
Not next month. Not next year. But over 8 to 12 years? The relationship becomes remarkably clear.
Think of it like buying a rental property. If you overpay for the house relative to the rent it generates, your returns will suffer. Pay a reasonable price, and you’ll do fine. The same logic applies to stocks - except instead of monthly rent, we’re looking at corporate sales, earnings, or economic output.
Breaking Down the Math (I Promise It’s Simple)
Let me walk you through a brilliantly simple framework that shows exactly how valuation affects your future returns. This comes from market researcher John Hussman, and once you see it, you can’t unsee it.
Start with the obvious:
Price = Price
Nothing controversial there. Now let’s get slightly more interesting:
Price = Price-to-Sales Ratio × Sales
In other words, the market’s total value equals some multiple of corporate revenues. Still with me? Good.
Now here’s where it gets interesting. Let’s compare today’s price to some future price:
Future Price / Today’s Price = (Future PSR / Today’s PSR) × (Future Sales / Today’s Sales)
What this equation tells us is that your investment return comes from two sources:
Changes in valuation (the PSR ratio going up or down)
Growth in the underlying business (sales increasing over time)
If we assume sales grow at a steady rate “g” over T years, we can write:
Future Price / Today’s Price = (Future PSR / Today’s PSR) × (1+g)^T
To figure out your annualized return, we convert this to an annual rate and add dividends:
Average Annual Total Return = (1+g) × (Future PSR / Today’s PSR)^(1/T) – 1 + Average Dividend Yield
What This Equation Actually Means for You
Here’s the kicker: over the long run, that valuation ratio tends to revert to its historical average.
When you buy stocks at sky-high valuations, that (Future PSR / Today’s PSR) term becomes a drag on your returns - it’s a number less than 1. The valuation multiple has to contract back toward normal levels, which hurts your returns even if sales grow nicely.
When you buy at depressed valuations, that term works in your favor - it’s greater than 1. The valuation expansion adds to your returns on top of whatever growth the economy delivers.
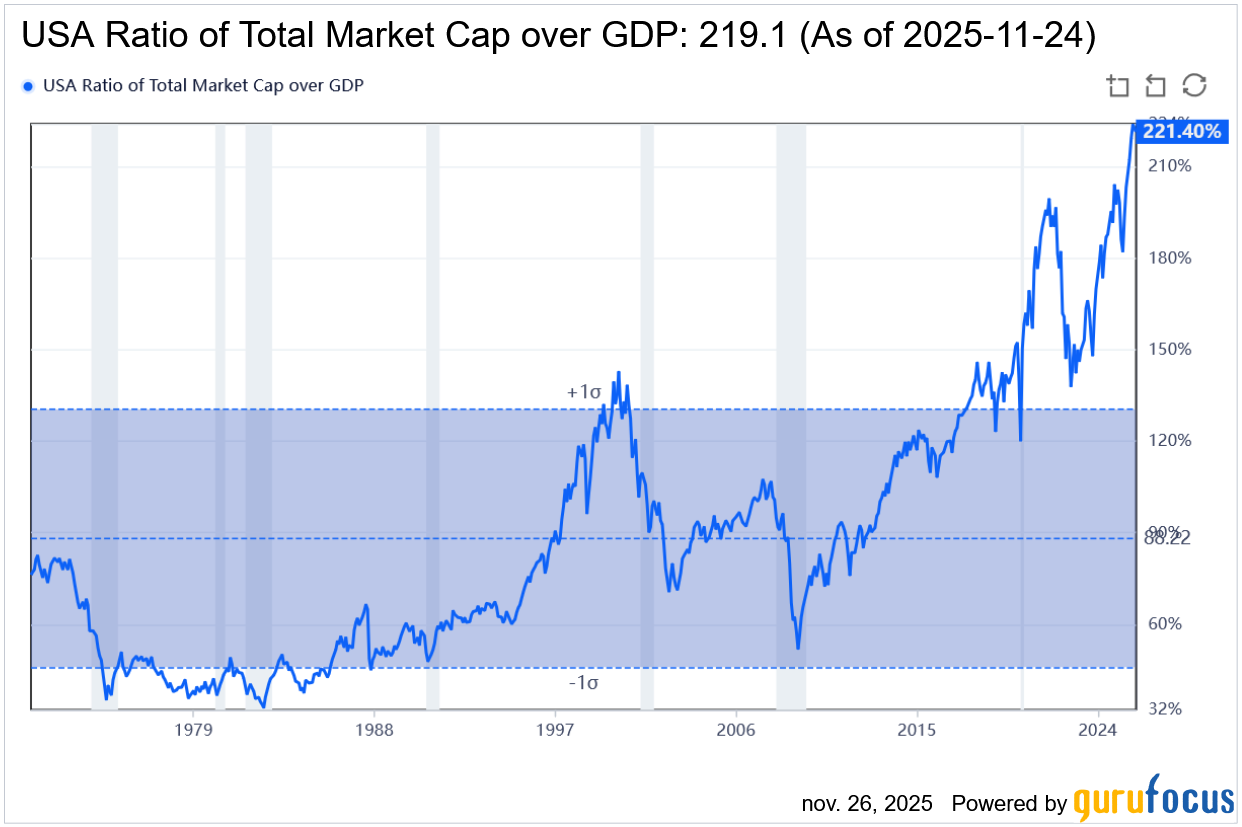
This is why Warren Buffett’s favorite indicator, the market capitalization-to-GDP ratio, works so well. It captures this relationship between market price and underlying economic fundamentals.
Why Revenue-Based Metrics Work Best
You might wonder: why use sales or GDP instead of earnings?
Three reasons:
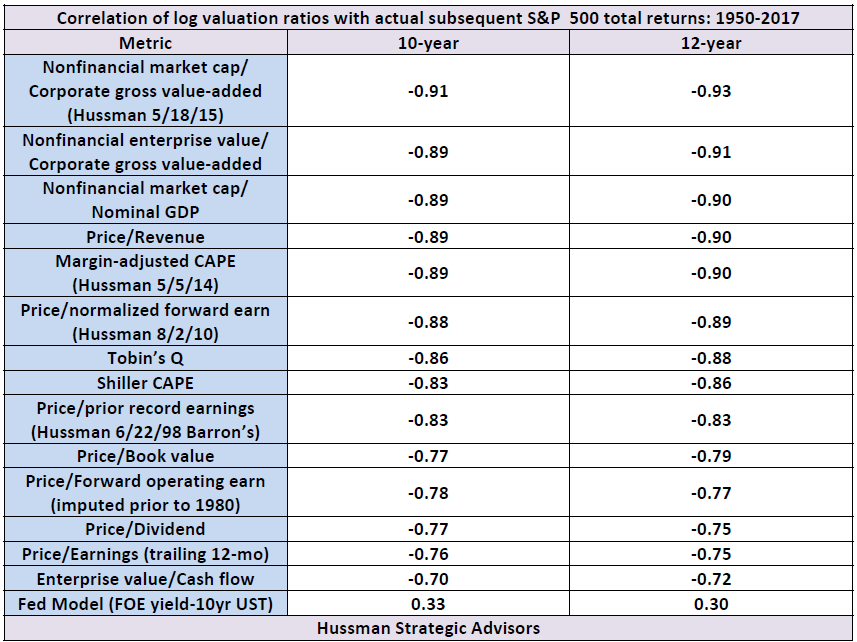
First, proportionality matters. The fundamental you choose should track the long-term cash flows that stocks ultimately deliver. Sales and economic output do this reliably.
Second, stability counts. Earnings bounce around wildly over the business cycle - they can even go negative during recessions. Sales and GDP are much steadier, giving you a clearer signal.
Third, proof is in the pudding. When researchers test which metrics best predict 10-12 year returns, revenue-based and GDP-based measures consistently win. The technical term is that their logarithms show tight correlation with subsequent returns, but you don’t need to worry about that, just know they work.
Bonus fourth reason: It’s best when the numerator and denominator match properly. The S&P 500 index to S&P 500 revenues is an apples-to-apples comparison. Market cap to GDP is pretty good too, though slightly less precise since corporate profits aren’t quite the same as total economic output.
The Critical Limitations You Need to Understand
Before you rush off to rebalance your portfolio, understand what this approach cannot do:
It Doesn’t Work for Individual Stocks
This relationship holds beautifully for broad market indices, the U.S. stock market, European equities, and emerging markets as a whole. But it largely falls apart for individual companies or even sectors.
Why? Because at the individual level, too many other factors dominate. A company might deserve a high valuation because it’s the next Apple, or a low valuation because it’s the next Kodak. Competitive dynamics, management quality, and technological disruption, these create so much noise that the valuation signal disappears.
At the aggregate level, these individual differences wash out. What you’re left with is the cleaner relationship between price and value.
It’s Useless for Market Timing
That 8-12 year timeframe isn’t a suggestion - it’s a hard constraint.
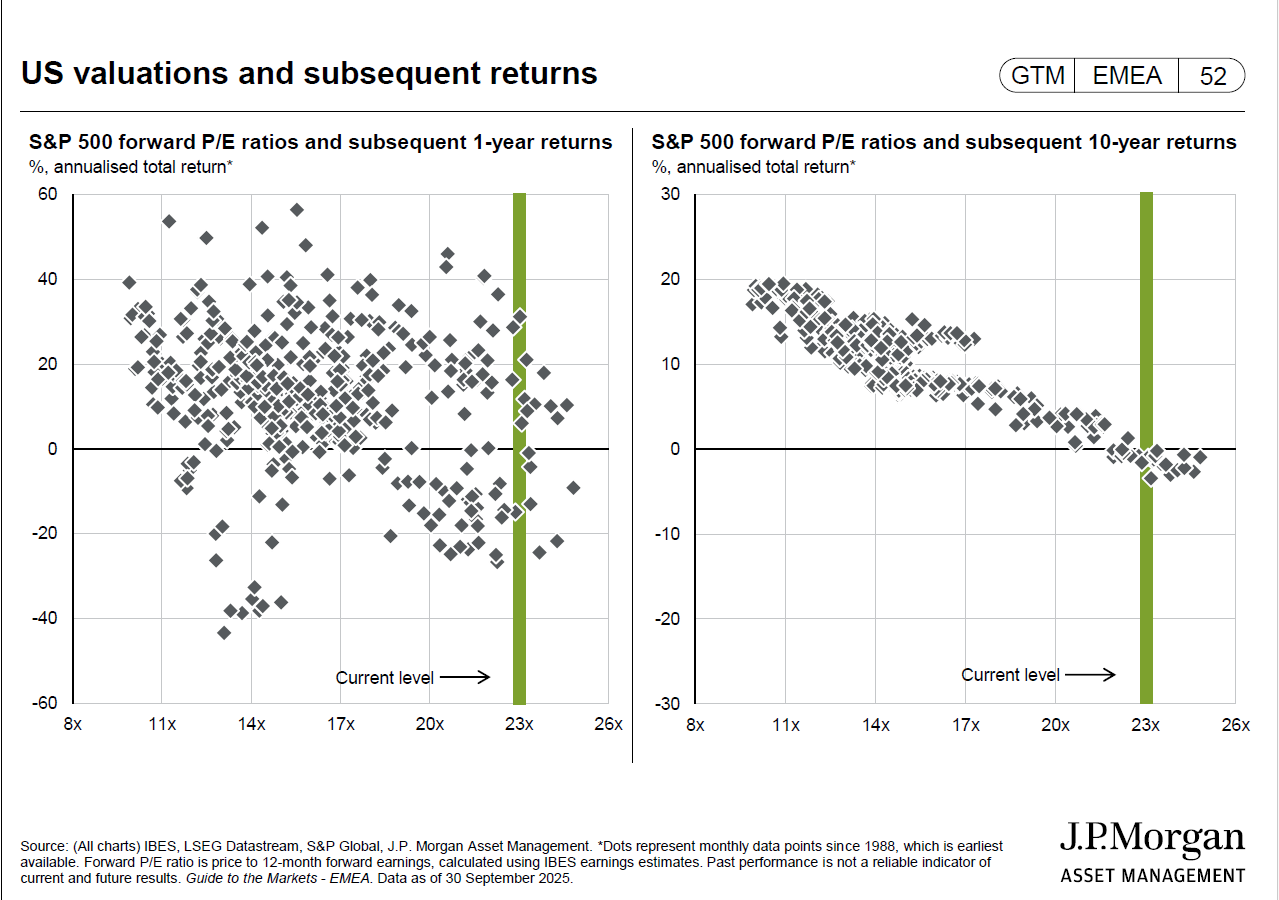
Over weeks, months, or even two or three years, valuation tells you almost nothing about where stocks are headed. Expensive markets can get more expensive for years. Cheap markets can get cheaper still. This is why you see so many investors who “knew” the market was overvalued get burned by exiting too early and watching from the sidelines as prices climbed higher.
Markets can remain disconnected from fundamental value far longer than most people can maintain their discipline.
What You Should Actually Do With This Information
So if you can’t time the market, what’s the point of understanding all this?
Use it to calibrate your expectations, not your trades.
When aggregate valuations are elevated - say, when the market-cap-to-GDP ratio sits well above its historical average - it is associated with below-average returns over the coming decade. Not next quarter. Not next year. But over the full 10-12 year horizon. Math provides a framework for understanding how valuations influence long-term outcomes, based on historical data. (It is not a guarantee of future results.)
This doesn’t mean selling everything and hiding in cash. It means:
Being realistic about likely outcomes
Perhaps maintaining a slightly more conservative allocation.
Definitely avoiding the trap of extrapolating recent stellar returns into the indefinite future.
Keeping your financial plan grounded in realistic assumptions
Conversely, when valuations are depressed - when everyone feels terrible about stocks - long-term returns have often been higher than average, assuming broad market exposure. Your future returns get a tailwind from both sales growth and valuation expansion. This historical tendency can inform how investors think about future possibilities, though outcomes remain uncertain.
Why I Care About This
I’ll be honest with you: understanding this framework changed how I think about investing. Not because it made me smarter at trading - it didn’t, and it won’t make you smarter at trading either. But it gave me something more valuable: realistic expectations.
When markets are expensive, I no longer kid myself about earning 10% annually over the next ten years. The math won’t allow it unless sales growth is extraordinary or valuations climb even higher, which would just set up an even bigger problem later.
When markets are cheap, I can stay invested even when CNBC makes me want to hide under my bed. The math reminds me that today’s pain is tomorrow’s opportunity.
This is what Hussman means by “making friends with bears through math.” You don’t have to love market downturns, but you can at least understand their gift: they reset valuations to levels that make the next decade’s returns far more attractive.
Key Takeaways for Long-Term Investors
The relationship between today’s valuation and future returns is one of investing’s few reliable patterns - but only at the aggregate level and only over 8-12 year horizons.
Market cap-to-GDP (the Buffett Indicator) and price-to-sales ratios work best because they use fundamentals that are stable, proportional to long-term cash flows, and proven to correlate with actual subsequent returns.
Use this knowledge to manage your expectations and adjust your long-term allocation - not to jump in and out of markets based on short-term moves.
Individual stocks are too noisy for this approach. Stick to broad market indices if you want to apply these principles.
When everyone’s excited and valuations are stretched, the math says be cautious about your decade-ahead expectations. When everyone’s pessimistic, and valuations are compressed, the math says opportunity knocks - even if it doesn’t feel that way.
If you enjoyed this, explore more articles and ideas on my blog here.
Disclaimer
The views and opinions expressed on this website are for educational and informational purposes only, and should not be considered as investment advice. The author may hold positions in the stocks mentioned on this website. The author of this website is not a licensed stockbroker or financial advisor. Nothing contained herein should be construed as a recommendation to buy, hold, or sell any securities or financial products. Always seek the advice of a financial advisor and do your own independent research before making any trade or investment decisions.
We do not guarantee the accuracy or completeness of any information on this website. Such information is provided “as is” without warranty or condition of any kind, either express or implied. Past performance may not be indicative of future results. This website could include inaccuracies or typographical errors.
We are not liable or responsible for any damages incurred whatsoever from actions taken from information provided on this website, including financial losses. Since all readers who access any information on this website are doing so voluntarily and of their own accord, any outcome of such access is understood to be their sole responsibility. In no event shall we be liable to any person for any decision made or action taken in reliance upon the information provided herein.